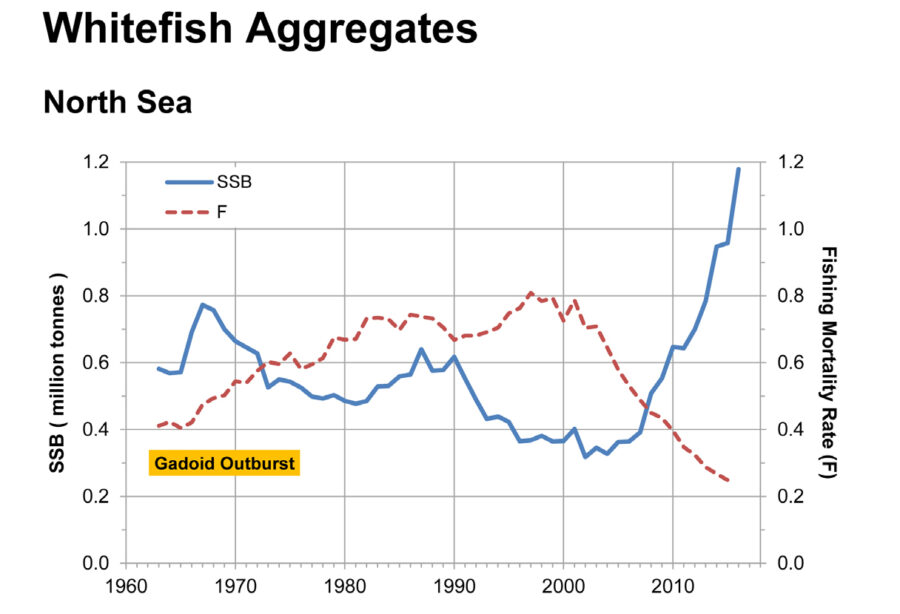
The extent to which spawning stock biomasses of most whitefish in Scottish waters have increased since the mid-2000s (at the same time as fishing mortality rates have declined), is vividly documented in the new report: ‘Trends in Scottish Fish Stocks 2016’ – researched and compiled by Dr Ian Napier, senior policy advisor at the NAFC Marine Centre, Scalloway, reports David Linkie.
Summarising the most recently published data from the International Council for the Exploration of the Sea (ICES) on the state of commercially important fish stocks in the waters around Scotland, the report clearly shows substantial increases in both demersal and pelagic stocks, as well as equally marked reductions in the level of exploitation; a trend that has steadily developed since the mid-2000s.
The continuing rise in stock levels, which skippers have consistently reported for more than 10 years, is clearly shown in a series of individual graphs covering off the main species caught by the Scottish fleet.
The graphs are based on two sets of data:
● Spawning Stock Biomass (SSB) – the estimated biomass (weight) of sexually mature fish in a stock, which is commonly used as a measure of the size of the stock.
● Fishing Mortality Rate (F) – a measure of the proportion of a fish stock that is removed (caught) each year. F is measured on a logarithmic scale; thus a value of 1.0 (F1.0) corresponds to 63% of the stock being removed each year, F0.7 corresponds to 50% of the stock being removed and F0.5 to 39%.
The timescale of the graphs illustrating SSB and F dates back to 1960, and encompasses the Gadoid outburst experienced at this time. For reasons that are still unclear, there was an unprecedented increase in the abundances of gadoid species (such as cod, haddock, saithe and whiting) in the North Sea, with a five- to six-fold increase in their biomass.
The available time-series of abundance of some of the gadoid fish stocks start around the time of gadoid outburst, thereby possibly giving a misleading impression of the ‘normal’ size of these stocks. Therefore, fisheries scientists have since suggested that the declines in the abundances of these gadoid species recorded in the 1970s and into the 1980s should be regarded as a return to ‘normal’ levels of abundance.
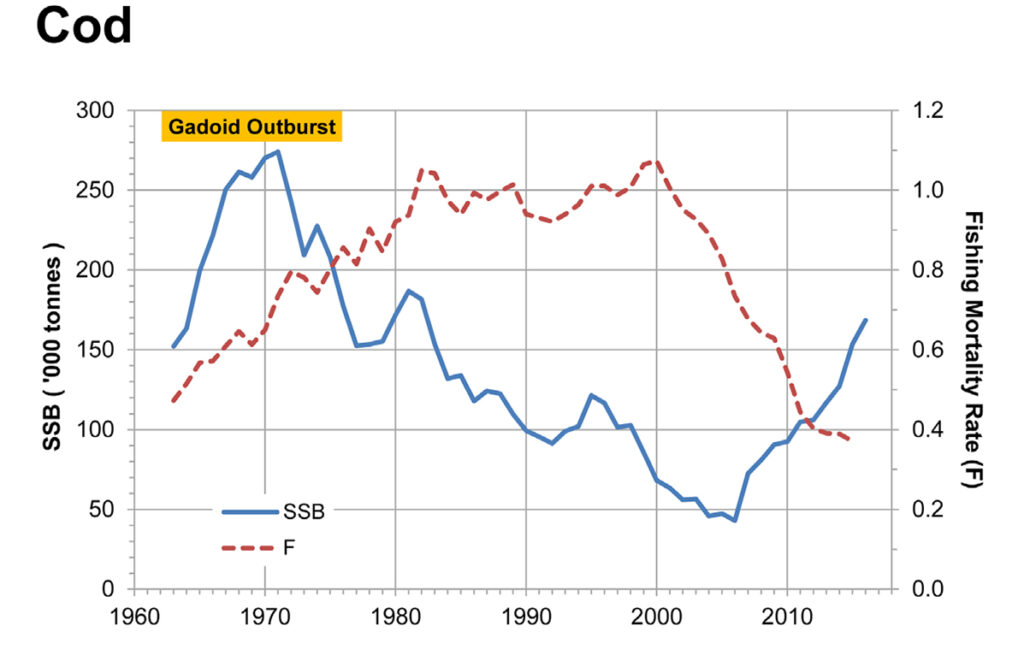
Cod (see graph 1)
The abundance of cod in the North Sea peaked during the gadoid outburst in the 1960s and 1970s. Following the outburst, the SSB declined steadily until the mid-2000s. From a low in 2006, the SSB has increased relatively rapidly, almost four-fold by 2016.
The F increased during the period of the gadoid outburst and remained high during the 1980s and 1990s. Since about 2000, it has fallen steeply, declining by two-thirds between 2000 and 2016. Since 2011, the value of F has been lower than at any time in the last 60 years.
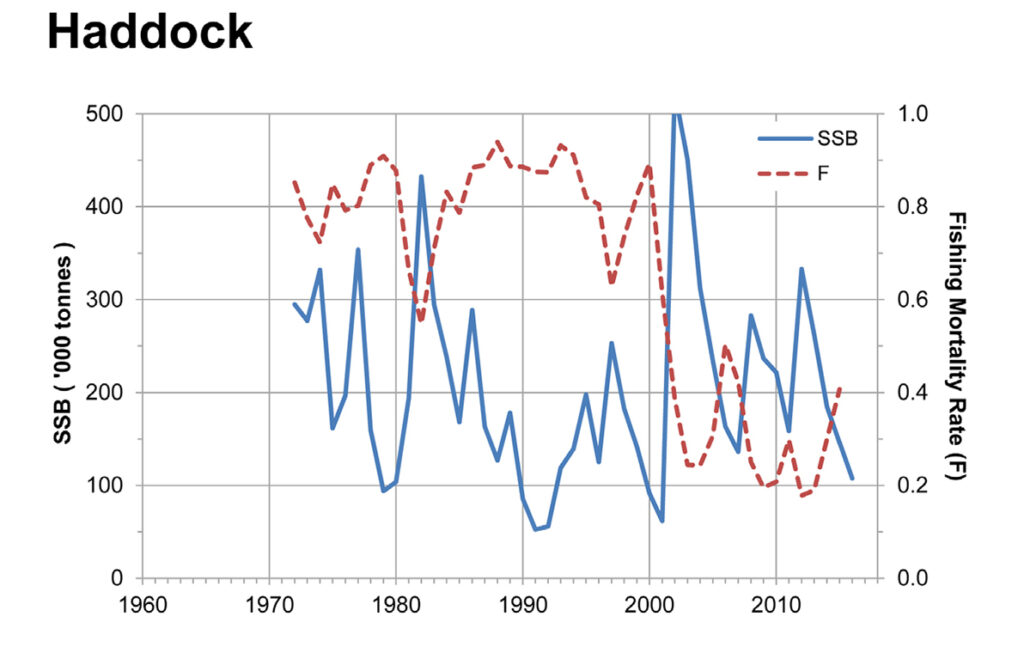
Haddock (see graph 2)
Since 2015, North Sea and West of Scotland haddock have been assessed as a single stock.
The SSB of the North Sea and West of Scotland haddock stock has experienced very large fluctuations over the last 40 years (reflecting the biology of the species). There was a general decline in the stock size until the early 1990s, since when there has been a general increase. The average SSB in the years 2010 to 2016 was almost double that from 1990 to 1995.
The F for North Sea and West of Scotland haddock remained relatively high until 2000, since when it has fallen sharply. The value of F in 2015 remained less than half of that in 2000, although it has increased in recent years.
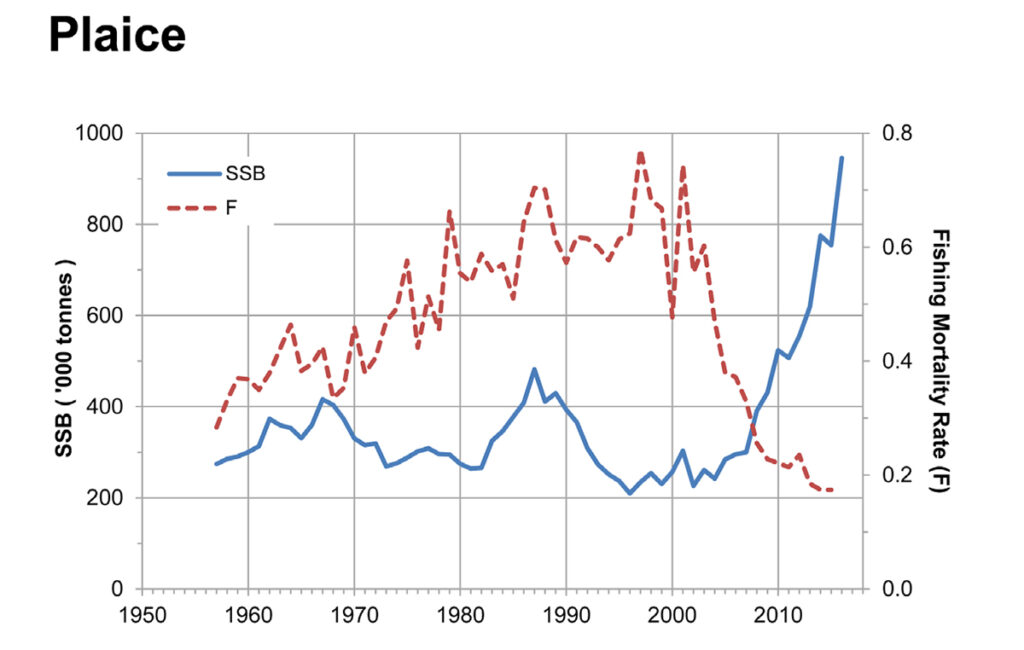
Plaice (see graph 3)
The SSB of plaice in the North Sea remained relatively stable from the 1960s to the mid-2000s, albeit with some large fluctuations. Since then there has been a substantial and rapid increase in the size of the stock, which almost quadrupled between 2004 and 2016. The SSB in 2016 was larger than at any time since at least 1957, and was three times larger than the average prior to 2004.
The F for plaice in the North Sea generally increased, though with large fluctuations, from the 1960s through the 1990s. It fell steeply thereafter, declining by 75% between 2001 and 2011. The value of F in 2016 remained about one-quarter of that in 2001 and lower than at any time since at least 1957.
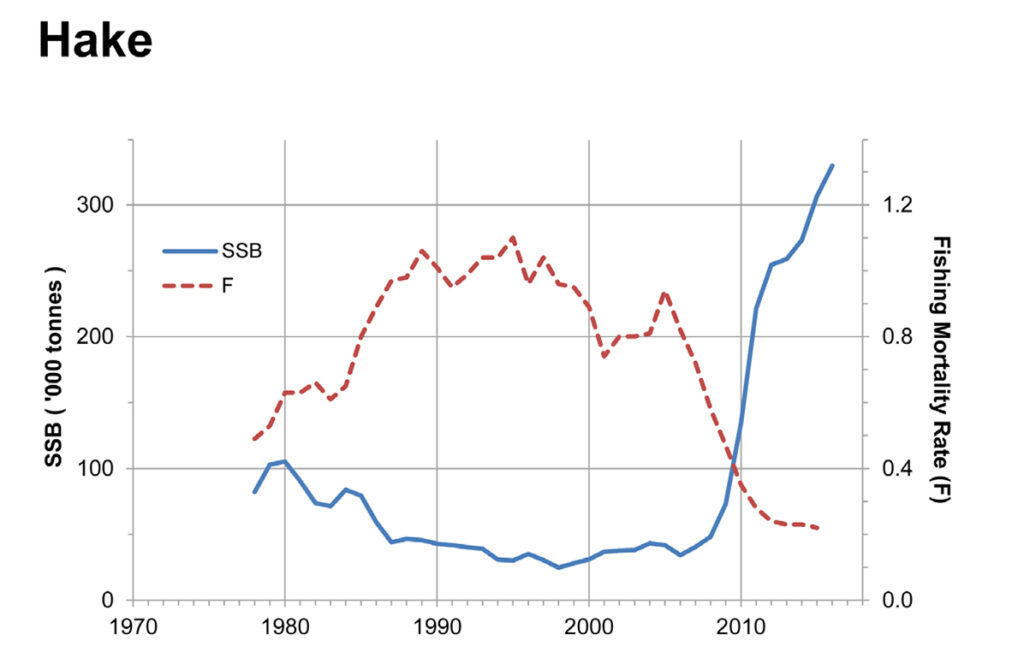
Hake (see graph 4)
Following a general decline during the 1980s and 1990s the SSB of the northern hake stock has increased rapidly and dramatically since the mid-2000s. The SSB increased almost 10-fold between 2006 and 2016.
The F for the northern hake stock rose during the 1980s but has generally declined since then, especially after 2005. The value of F in 2016 was less than one quarter of that in 2005, and lower than at any time in the last 40 years.
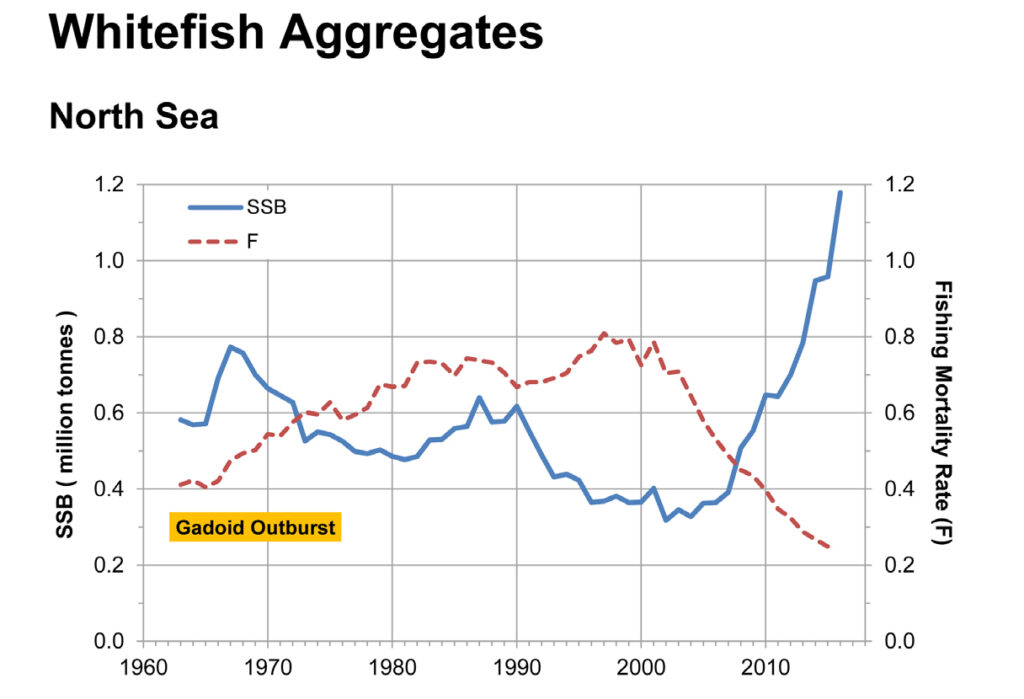
Whitefish Aggregates North Sea (see graph 5)
The combined SSB of cod, plaice and common sole (the only North Sea whitefish species for which long-term timeseries of abundance are available) generally declined through the 1970s, 1980s and 1990s, following the peak associated with the gadoid outburst during which the abundances of cod were enhanced (plaice and sole are not gadoid species).
From about the mid-2000s, the combined SSB has increased rapidly, due to the increasing abundances of all three species (but especially plaice). The combined SSB more than tripled between 2004 and 2016, reaching a size greater than at any time since at least 1963.
The F for cod, plaice and Dover sole in the North Sea generally increased until the mid-1980s, but has fallen since about 2000. The average value of F in 2015 was less than one-third of that in 2001 and at its lowest since at least 1963.
General Remarks
Two general trends are apparent from the whitefish data:
● The SSB of most whitefish stocks have increased since the mid-2000s, in some cases by substantial amounts.
● The F for all the species covered have declined since the mid-2000s, again by substantial amounts in some cases.
Although the sizes of some stocks (such as cod and haddock) remain below levels seen in the past, stocks of others (such as plaice and hake) are at historic highs.
The overall picture of whitefish stocks provided by the data is of generally increasing stock sizes and decreasing (and relatively low) fishing mortality rates.
The full report can be viewed at: nafc.uhi.ac.uk/fish-stocks

