Catch value by UK fleet exceeds £1bn for the first time
Provisional statistics released by the MMO last month indicated that the annual catch value for the UK fleet exceeded £1bn for the first time in 2018, when vessels landed 696,318t for a record value of £1,004,812,000, reports David Linkie
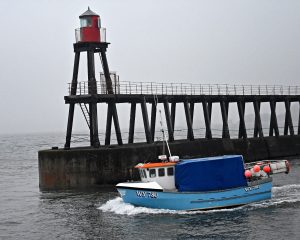
UK under-10m boats landed catches totalling 36,045t for £112.4m in 2018, of which crab and lobster accounted for more than £55m.
The initial estimated 2018 totals represent a 3% rise in annual value, and a 4% drop in tonnage, compared to the respective 2017 totals of £980m from 724,333t.
Of the 2018 catches from UK vessels, 424,075t for £731.4m was landed into British ports. These figures represent an increase of 1% on the 2017 total value of £720.7m, and a 2% reduction on the annual tonnage of 434,057t, and reflect a 4% rise in the average price (£/t) to £1,731 for 2018, compared to the previous year’s value of £1,663.
Landings by UK vessels abroad totalled £273.5m from 272,243t last year, and represent a rise of 5% in catch value and a 6% reduction in tonnage on the 2017 totals of £259.4m and 290,276t. The average price per tonne for all species landed abroad was 12% higher at £1,009. The pelagic sector recorded the biggest average price rise of 22%, double that of demersal species at 11%. The average price for shellfish landings abroad dropped by 3%. In terms of individual species, plaice showed the biggest percentage increase of 37%, followed by Nephrops (35%), mackerel (33%) and crabs (13%).
| Table 1: 2018 top 20 species by value landed into the UK and abroad by UK vessels | |||||||||
| Species | Value 2018 | Value 2017 | Value % change 2018/2017 | Tonnage 2018 | Tonnage 2017 | Tonnage % change 2018/2017 | Price £/t 2018 | Price £/t 2017 | Price £/t % change 2018/2017 |
| Mackerel | £226,007,000 | £241,022,000 | -6% | 191,077t | 226,458t | -15% | £1,183 | £1,066 | 10% |
| Nephrops | £83,129,000 | £96,658,000 | -13% | 25,473t | 29,867t | -15% | £3,265 | £3,237 | 1% |
| Crabs | £79,060,000 | £62,061,000 | 27% | 34,692t | 35,980t | -4% | £2,280 | £1,725 | 32% |
| Cod | £70,321,000 | £59,722,000 | 18% | 34,507t | 35,902t | -4% | £2,094 | £2,046 | 2% |
| Scallops | £69,989,000 | £73,042,000 | -10% | 29,216t | 32,136t | -9% | £2,400 | £2,278 | 5% |
| Monkfish | £59,117,000 | £57,253,000 | 3% | 18,637t | 19,640t | -5% | £3,006 | £2,947 | 2% |
| Haddock | £51,457,000 | £51,044,000 | 1% | 35,544t | 34,008t | 5% | £1,449 | £1,508 | -4% |
| Herring | £45,311,000 | £35,783,000 | 27% | 103,573t | 83,687t | 24% | £438 | £420 | 4% |
| Lobsters | £44,144,000 | £43,412,000 | 2% | 3,048t | 3,294t | -7% | £14,484 | £13,189 | 10% |
| Hake | £27,851,000 | £31,426,000 | -11% | 12,742t | 14,591t | -12% | £2,191 | £2,156 | 2% |
| Squid | £25,419,000 | £24,949,000 | 2% | 7,774t | 7,360t | 6% | £3,417 | £3,954 | -15% |
| Plaice | £22,878,000 | £23,443,000 | -2% | 12,233t | 17,618t | -31% | £1,871 | £1,376 | 36% |
| Whelks | £21,983,000 | £22,939,000 | -4% | 17,992t | 20,927t | -14% | £1,222 | £1,096 | 11% |
| Sole | £18,674,000 | £16,726,000 | 11% | 1,853t | 1,828t | 13% | £10,082 | £9,157 | 10% |
| Blue whiting | £16,651,000 | £14,499,000 | 15% | 72,884t | 68,133t | 7% | £228 | £213 | 7% |
| Cuttlefish | £14,861,000 | £25,064,000 | -40% | 3,965t | 6,999t | -44% | £3,758 | £3,593 | 5% |
| Megrim | £14,782,000 | £13,361,000 | 10% | 4,947t | 4,498t | 10% | £3,006 | £2,977 | 1% |
| Whiting | £14,602,000 | £12,521,000 | 17% | 11,667t | 10,154t | 15% | £1,253 | £1,234 | 2% |
| Saithe | £12,961,000 | £11,389,000 | 14% | 15,995t | 11,789t | 35% | £881 | £990 | 11% |
| Ling | £8,876,000 | £8,680,000 | 2% | 5,759t | 5,285t | 9% | £1,545 | £1,645 | -6% |
| Total all species | £1,004,812,000 | £980,065 | 3% | 696,318t | 724,333t | -4% | £1,449 | £1,358 | 7% |
| Source: Fisheries administrations in the UK | |||||||||
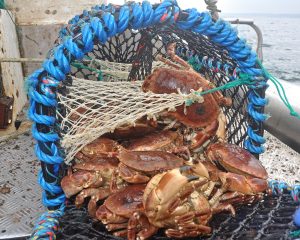
Brown crab moved from fifth position to third in terms of annual catch value, as a result of a 32% rise in average price value to £2,280 per tonne in 2018.
With a value of £358.6m from 134,850t, shellfish landings by the UK fleet were slightly ahead of demersal catches worth £349.3m (175,780t), while pelagic species contributed a further £296.9m (385,688t).
A similar ranking order by species, but with a wider differential, applied to landings by UK vessels into UK ports, with shellfish totalling £325.1m, demersal £285.7m and pelagic £120.5m. Under this criteria, mackerel (£94.5m) is the single most valuable species, followed by Nephrops (£78.6m), scallops (£69.6m), crabs (£68m), cod (£54.4m), haddock (£50.9m), monkfish (£47.3m) and lobsters (£43.6m).
The pattern changes significantly when the focus is landings abroad by UK vessels, with pelagic catches of £176.5m well ahead of demersal (£63.5m) and shellfish (£33.5m).
By value, mackerel (£226m/191,077t) was the single most important species landed by UK vessels into the UK and abroad in 2018, followed by Nephrops (£83.1m/25,473t).
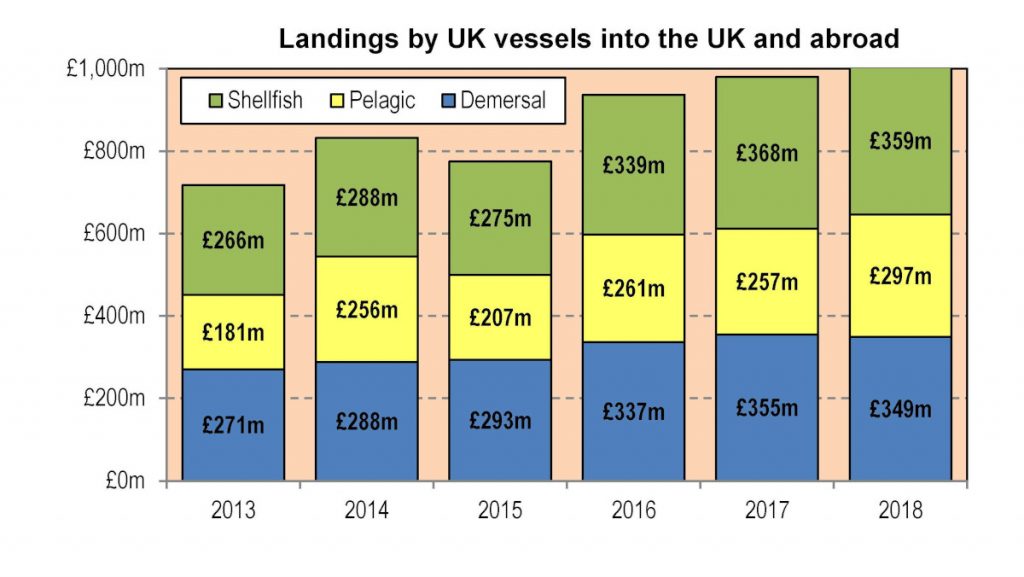
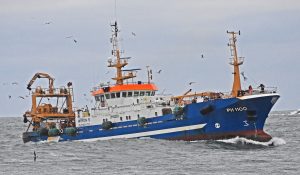
At £226m, mackerel was the single most valuable species landed by UK vessels in 2018.
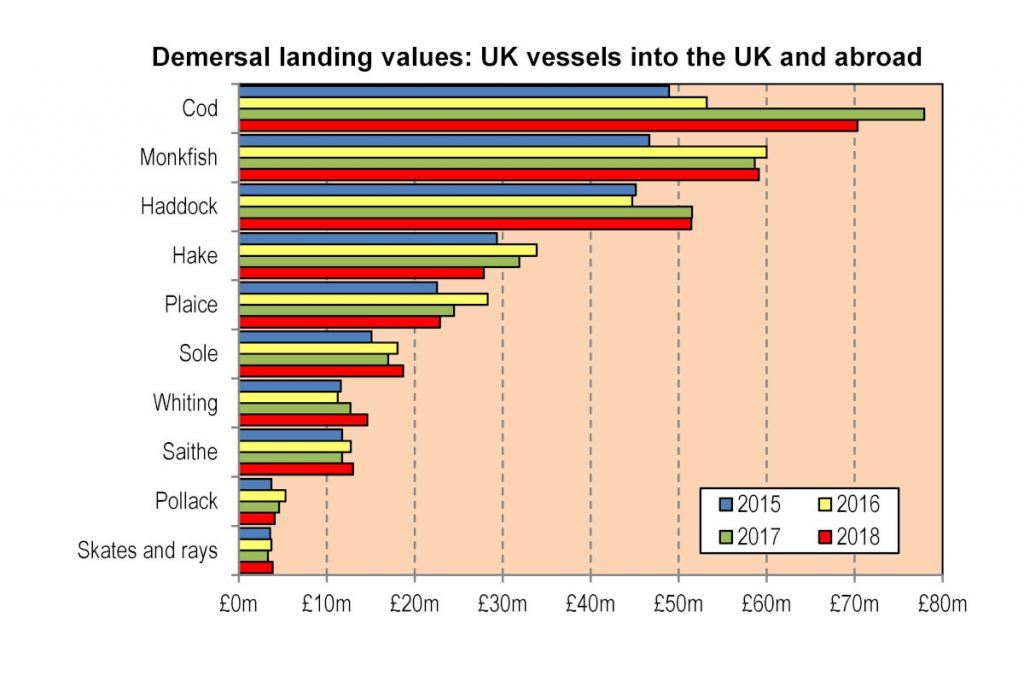
As a result of a 32% increase in quayside prices, associated with high levels of demand from markets in China, crabs (£79m/34,692t) moved into third position, replacing scallops (£70m/29,216t) which dropped to fifth place. A 14% price rise kept cod (£70.3m/34,507t) in fourth place in the value table, therefore being the most valuable demersal species, ahead of monkfish (£59.1m/18,673t) and haddock (£51.5m/35,544t). Herring (£45.3m/103,573t) moved from 10th to eighth place, ahead of lobsters (£44.1m/3,048t) and hake (£27.9m/12,742t).
In terms of annual value, shellfish again occupied three of the top five places in the 2018 catch value table, with Nephrops, crabs and scallops contributing to an aggregate total of £232.1m.
The characteristic mixed nature of catches by UK vessels was further illustrated by the fact that outside of the top 10, a further nine species – squid, plaice, whelks, sole, blue whiting, cuttlefish, megrim, whiting and saithe – all returned values in excess of £10m. (Table 1)
Of the £731.4m from 424,075t that UK vessels landed into harbours in England, N Ireland, Scotland and Wales last year, the under-10m fleet contributed £112.4m from 36,045t. Of this total, shellfish (£89.8m) accounted for 80%.
| Table 2: UK top 25 ports in 2018 by value of landings from UK vessels | ||||||
| Port | Value 2018 | Value 2017 | Value 2016 | Tonnage 2018 | Tonnage 2017 | Tonnage 2016 |
| Peterhead | £178,977,000 | £165,794,000 | £157,600,000 | 152,670t | 151,917t | 145,364t |
| Lerwick | £45,758,000 | £40,994,000 | £51,835,000 | 41,772t | 39,133t | 51,154t |
| Fraserburgh | £41,838,000 | £45,617,000 | £36,062,000 | 27,034t | 26,234t | 21,740t |
| Scrabster | £37,130,000 | £30,328,000 | £32,386,000 | 17,505t | 14,475t | 15,997t |
| Brixham | £35,712,000 | £40,151,000 | £30,724,000 | 12,346t | 14,993t | 13,262t |
| Newlyn | £29,817,000 | £29,674,000 | £27,309,000 | 13,939t | 13,505t | 14,108t |
| Ullapool | £17,896,000 | £14,438,000 | £15,319,000 | 8,861t | 7,777t | 6,985t |
| Shoreham | £16,883,000 | £11,735,000 | £7,878,000 | 7,644t | 5,617t | 4,042t |
| Kinlochbervie | £16,648,000 | £15,530,000 | £14,892,000 | 7,915t | 8,006t | 8,175t |
| Scalloway and isles | £16,169,000 | £15,844,000 | £12,769,000 | 7,804t | 7,896t | 7,872t |
| Plymouth | £11,067,000 | £15,652,000 | £14,701,000 | 6,255t | 10,564t | 11,317t |
| Bridlington | £10,307,000 | £9,526,000 | £8,729,000 | 3,521t | 3,230t | 3,512t |
| Kilkeel | £8,465,000 | £9,358,000 | £9,001,000 | 4,491t | 4,637t | 4,596t |
| Grimsby | £8,053,000 | £8,291,000 | £7,346,000 | 3,810t | 4,678t | 4,580t |
| Scarborough | £6,700,000 | £6,386,000 | £5,697,000 | 2,271t | 1,908t | 1,934t |
| Mallaig | £5,369,000 | £8,833,000 | £11,091,000 | 1,782t | 4,134t | 5,807t |
| Pittenweem | £5,360,000 | £4,308,000 | £3,461,000 | 973t | 979t | 1,264 |
| Portavogie | £5,217,000 | £6,336,000 | £6,551,000 | 2,460t | 2,928t | 3,404t |
| Eyemouth | £5,007,000 | £4,299,000 | £2,651,000 | 1,197t | 1,080t | 704t |
| Ardglass | £4,797,000 | £4,708,000 | £5,917,000 | 2,275t | 2,238t | 3,404t |
| North Shields | £4,057,000 | £5,280,000 | £6,105,000 | 1,470t | 1,951t | 2,405t |
| Belfast | £4,056,000 | £3,838,000 | £3,436,000 | 7,602t | 6,275t | 5,838t |
| Buckie | £3,869,000 | £4,077,000 | £3,948,000 | 1,027t | 1,333t | 1,273t |
| Kirkcudbright | £3,237,000 | £3,504,000 | £4,783,000 | 1,711t | 2,158t | 3,480t |
| Campbeltown | £2,948,000 | £3,097,000 | £4,029,000 | 705t | 1,313t | 1,808t |
| Total all UK ports | £731,356,000 | £705,626,000 | £691,400,000 | 424,075t | 428,807t | 445,069t |
| Source: Fisheries Administrations in the UK | ||||||
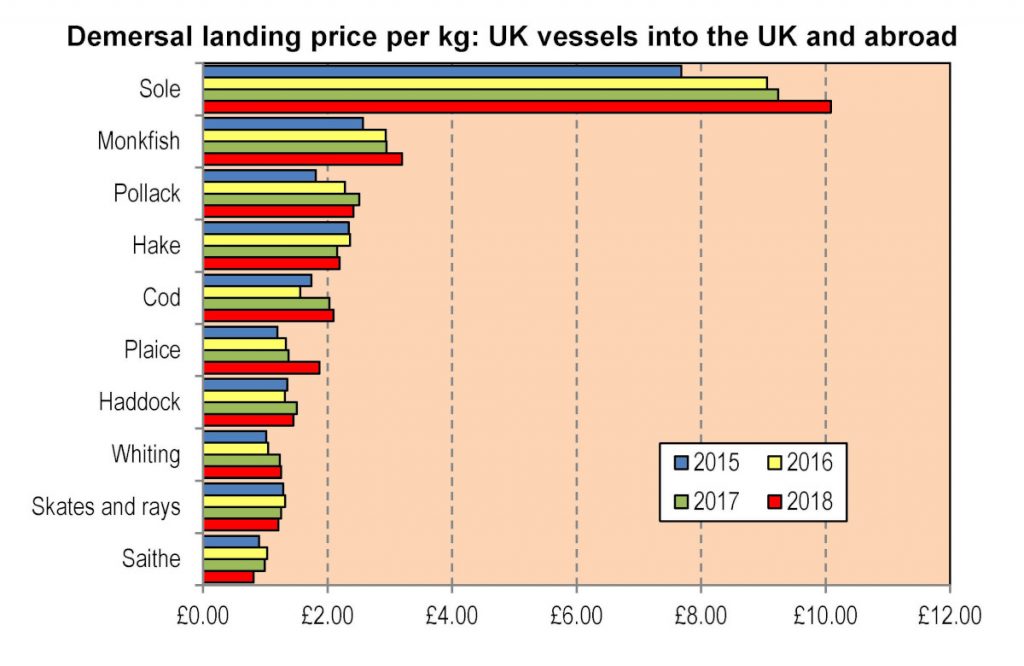
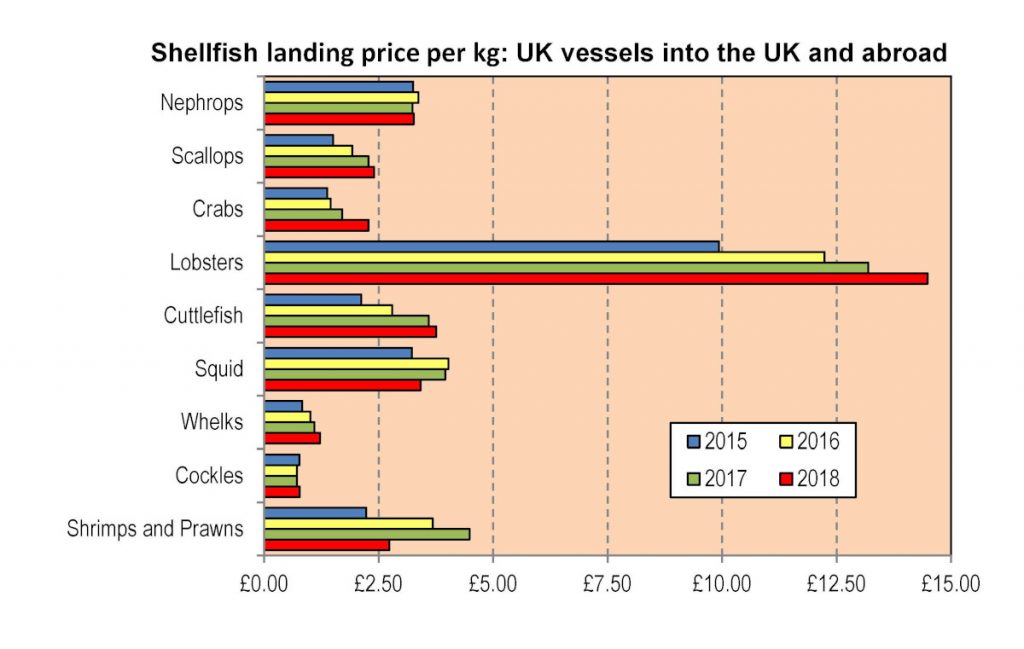

Lobsters (£29.2m/2,026t) were the most valuable species when viewed from the perspective of under-10m fishermen, followed by crabs (£25.9m/10,852t), Nephrops (£12.1m/2,678t), whelks (£8.6m/6,741t) and scallops (£5.6m/2,591t). Sole (£5m/573t) was the top demersal species for the under-10m fleet, followed by bass (£4m/396t), pollack (£1.6m/574t), plaice (£1.4m/817t) and skates and rays (£1.2m/872t). Some of these species were separated in the annual value table by mackerel (£2.2m/1,676t), cuttlefish (£1.3m/338t) and squid (£1.2m/872t).
In terms of annual catch value, crabs and herring recorded the biggest increases, of 27%, followed by cod (18%), whiting (17%), blue whiting (15%) and saithe (14%).
Cuttlefish (-40%) was subject to the biggest drop in terms of value, followed by Nephrops (-13%), hake (-11%) and scallops (-10%).
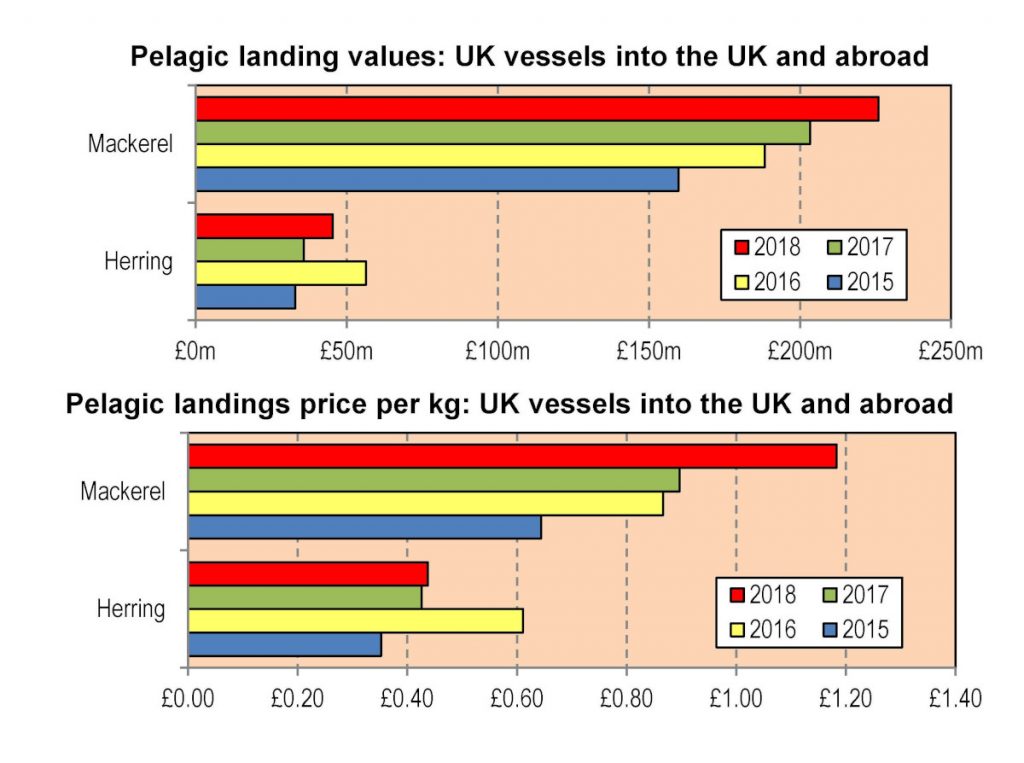
The average price per tonne for all species landed by the UK fleet increased by 7% to £1,449 last year, compared to £1,358 for the previous year. The £/t for landings into the UK rose 4% to £1,731 from £1,663, while landings abroad rose from £899 to £1,009 per tonne, an increase of 12%.
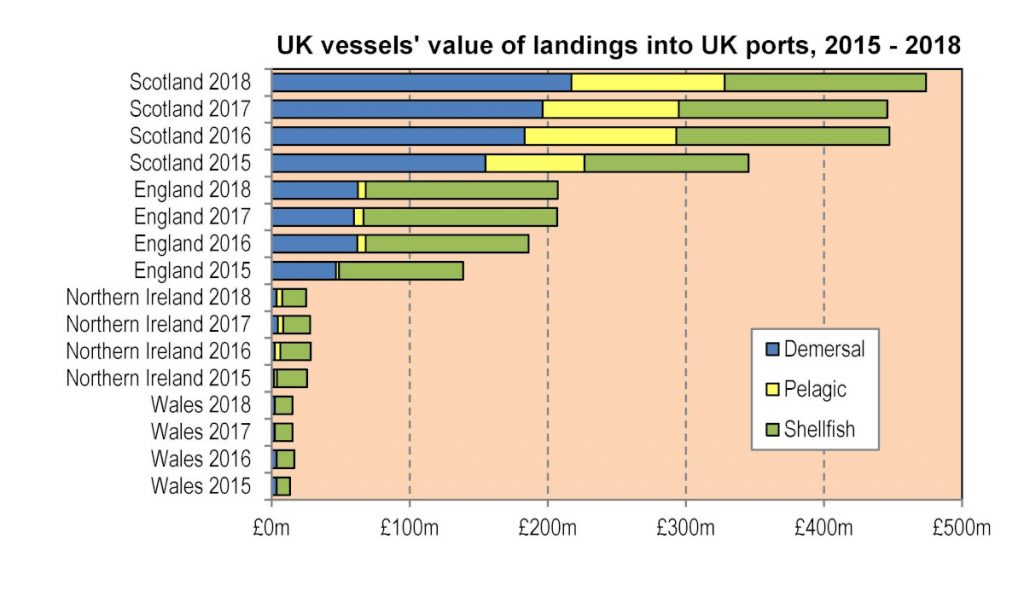
Within the UK, British boats landed catches totalling £207m/92,728t into England, £25m/18,642t into N Ireland, £473.8m/300,368t into Scotland, and £15.2m/7,341t into Wales.
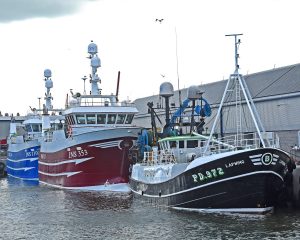
Peterhead continued to be the UK’s top port in 2018, with annual landings by British vessels of £179m and 152,670t.
Shellfish (£139.1m/58,022t) accounted for 58% of landings in England, including scallops (£36.7m/15,240t), crabs (£33.1m/14,459t), lobsters (£22m/1,558t), cuttlefish (£14.8m/3,931t), whelks (£13m/10,787t) and Nephrops (£7m/2,087t). In terms of demersal species, totalling £62.5m/22,180t, sole (£15.8m/1,534t) occupied first place, well ahead of monkfish (£6.5m/1,988t), hake (£4.8m/1,890t), plaice (£4.6m/2,413t), turbot (£4.2m/391t), bass (£3.6m/355t) and lemon sole (£3.4m/666t). Sardines contributed £2.8m/8,016t to the pelagic total of £5.6m/12,526t.
Nephrops (£11.9m/5,061t) dominated landings in N Ireland, well ahead of scallops (£2.3m/965t) and crabs (£2m/1,245t). Demersal species contributed £3.7m to the annual total, of which haddock accounted for £2.1m from 1,578t and monkfish £0.5m from 188t. On the pelagic front, mackerel (£2.3m/2,379t) led the way, ahead of herring (£1.8m/5,236t).
Catch value in Scotland was more evenly balanced, with demersal species accounting for £217.1m, shellfish £145.9m and pelagic £110.8m. Mackerel (£91.2m/76,956t) was the most valuable species, ahead of Nephrops (£59.5m/17,506t). Cod (£50.6m/21,648t) replaced haddock (£47.7m/32,614t) as the main demersal species landed in Scottish ports, ahead of monkfish (£40m/12,706t), hake (£20.1m/9,266t), whiting (£13.5m/10,345t), saithe (£10.6m/13,284t) and ling (£8.5m/5,441t). Crabs (£30m/11,228t), scallops (£21.5m/8,657t), lobsters (£17.7m/1,157t) and herring (£15.9m/43,416t) also made significant contributions.
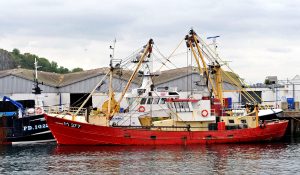
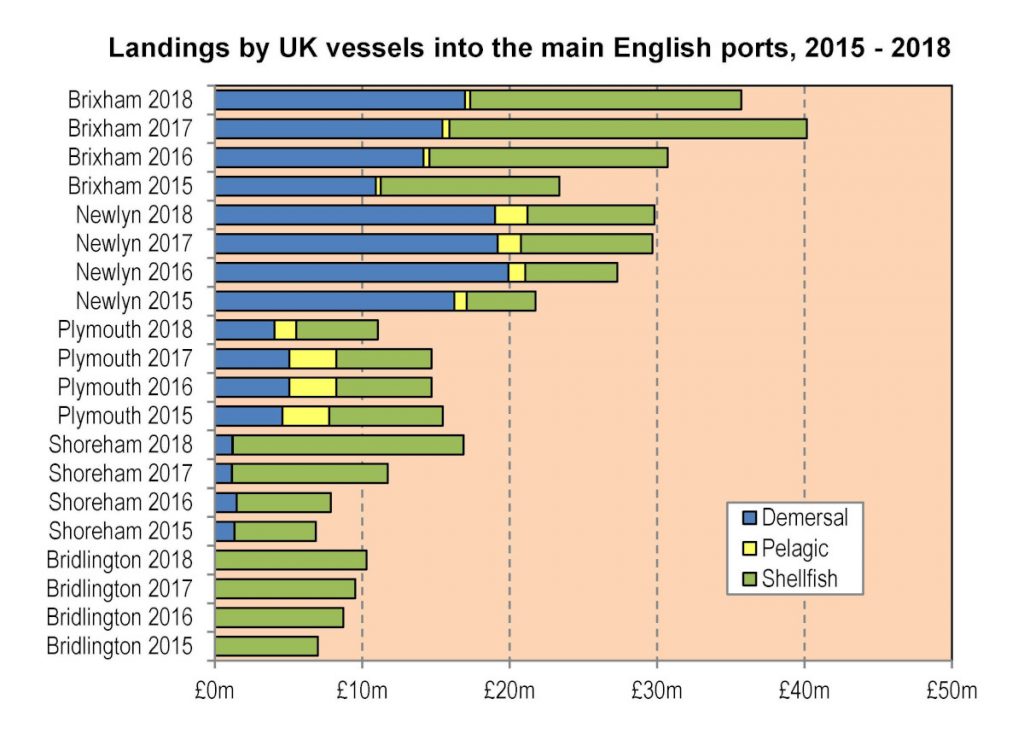
Brixham retained its position as the leading port in England.
In Wales, shellfish accounted for £12.8m (6,516t) of the total annual catch value of £15.2m (7,341t). Whelks (£5.8m/4,493t) were the top species landed, ahead of lobsters (£2.5m/192t), scallops (£2.3m/192t) and crabs (£1.6m/781t). From the demersal totals of £2.3m from 824t, at £0.7m/211t, megrim had almost double the value of monkfish (£0.37m/124t), followed by bass (£0.7m/73t) and skates/rays (£0.23m/198t).
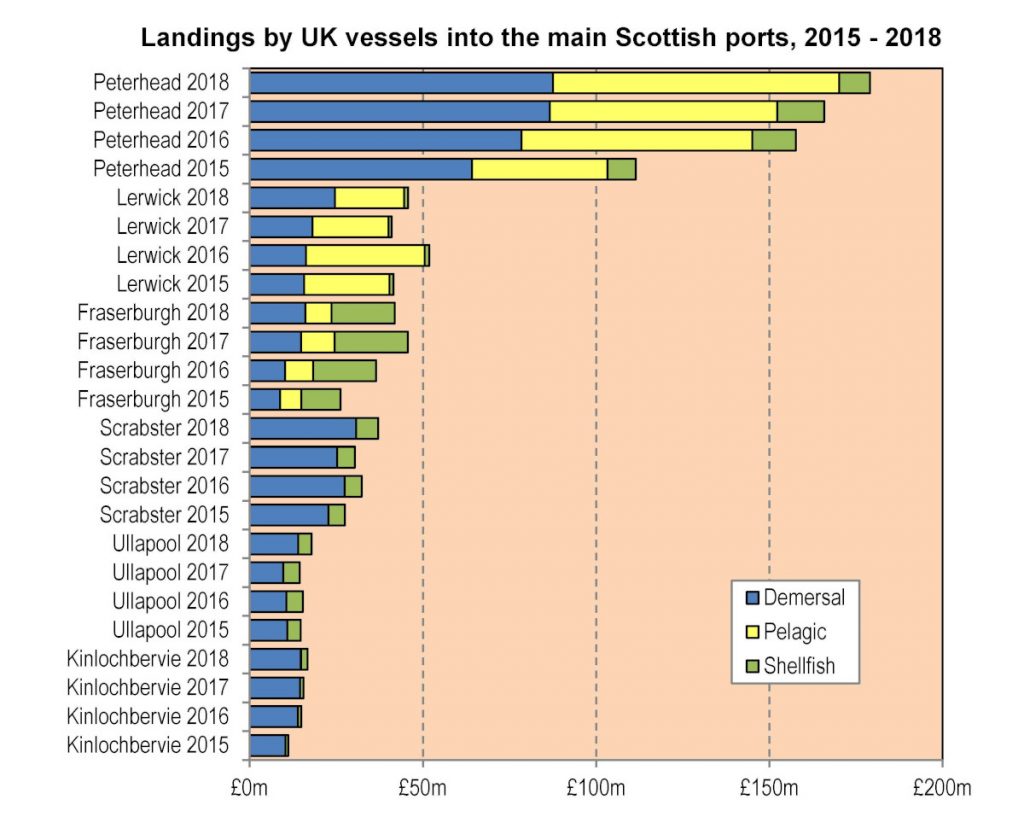
The top four ports in Scotland by catch value from UK vessels, Peterhead (£179m/152,670t), Lerwick (£45.8m/41,772t), Fraserburgh (£41.8m/27,034t) and Scrabster (£37.1m/17,505t), also occupied the first four places in the listing of the UK’s top 25 ports for landings by UK vessels only. (Table 2)
Other leading Scottish landing centres were Ullapool (£17.9m/8,861t), Kinlochbervie (£16.7m/7,915t), and Scalloway and isles (£16.2m/7,804t).
Brixham (£35.7m/12,346t) was the leading port in England, followed by Newlyn (£29.8m/19,939t), Shoreham (£16.9m/7,644t), Plymouth (£11m/6,255t) and Bridlington (£10.3m/3,521t).
In Northern Ireland, Kilkeel (£8.5m/4,491t) led the way from the neighbouring Co Down ports of Portavogie (£5.2m/2,460t) and Ardglass (£4.8m/2,275t).
| Table 3: 2018 top 12 species by value landed by UK under-10m vessels | |||||||||
| Species | Value
2018 |
Value
2017 |
Value
2016 |
Tonnage
2018 |
Tonnage
2017 |
Tonnage
2016 |
Price £/t 2018 | Price £/t 2017 | Price £/t 2016 |
| Lobsters | £29,227,000 | £28,983,000 | £26,799,000 | 2,026t | 2,198t | 2,216t | £14,450 | £13,187 | £12,095 |
| Crabs | £25,989,000 | £20,390,000 | £17,662,000 | 10,852t | 11,769t | 12,406t | £2,395 | £1,739 | £1,424 |
| Nephrops | £12,078,000 | £12,630,000 | £16,951,000 | 2,678t | 2,198t | 3,540t | £4,510 | £4,249 | £4,789 |
| Whelks | £8,643,000 | £10,490,000 | £11,135,000 | 6,714t | 9,662t | 11,089t | £1,287 | £1,086 | £1,004 |
| Scallops | £5,601,000 | £6,708,000 | £6,275,000 | 2,591t | 2,611t | 2,757t | £2,162 | £2,575 | £2,277 |
| Sole | £4,995,000 | £4,280,000 | £3,942,000 | 573t | 562t | 528t | £8,651 | £7,628 | £7,503 |
| Bass | £3,974,000 | £3,571,000 | £4,147,000 | 396t | 359t | 453t | £10,035 | £9,956 | £9,203 |
| Mackerel | £2,244,000 | £2,647,000 | £1,883,000 | 1,676t | 2,118t | 1,857t | £1,341 | £1,254 | £988 |
| Pollack | £1,609,000 | £1,672,000 | £1,439,000 | 574t | 646t | 650t | £2,802 | £2,589 | £2,213 |
| Plaice | £1,379,000 | £989,000 | £765,000 | 817t | 789t | 689t | £1,688 | £1,255 | £1,095 |
| Cuttlefish | £1,294,000 | £2,622,000 | £2,055,000 | 338t | 697t | 915t | £3,827 | £3,763 | £2,245 |
| Squid | £1,239,000 | £1,204,000 | £823,000 | 326t | 353t | 273t | £3,802 | £3,908 | £3,019 |
| Skates and rays | £1,210,000 | £1,067,000 | £942,000 | 872t | 734t | 663t | £1,390 | £1,460 | £1,430 |
| Total | £112,355,000 | £108,469,000 | £108,343,000 | 36,045t | 42,418t | 43,413t | £3,117 | £2,566 | £2,499 |
| Source: Fisheries Administration in the UK | |||||||||


